Reading Tide Data
Tides do not occur with the same frequency and magnitude everywhere. Tides influence the rise and fall of water both in the open ocean and along the coasts, although that rise and fall can be much more pronounced near land, which can have an amplifying effect.
NOAA has developed long-term data sets of local tide measurements from an array of permanent monitoring stations around the United States. Over the years, the technology for recording tides has changed from early mechanical recorders to modern acoustic and electronic devices. Today, this network of monitoring stations records tide measurements electronically every six minutes at over 250 stations around the country. The data is transmitted to NOAA headquarters via satellite where it is processed, archived, and made available online.
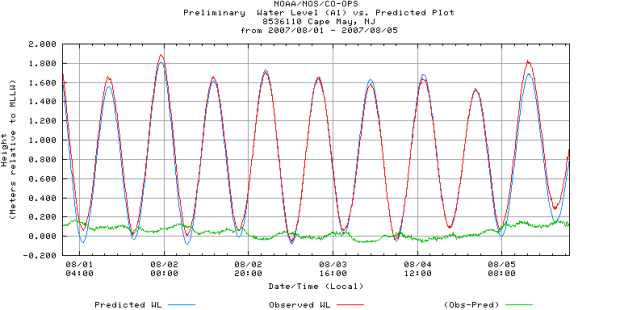
Use the tide chart below to check your understanding. Then try making your chart using real data.