Reading Sea Surface Height Data
Researchers believe that sea level worldwide is presently rising. Over the last 100 years, global sea level has risen about 15 cm (6 in.) and recently the rate of rise has increased. To study this phenomenon, scientists need to make good measurements of the sea surface height around the world. One tool they use is satellite altimetry, which allows them to look at a snapshot of sea surface height deviation (SSHD) around the world. SSHD is the difference between the height of the sea surface and the expected average height, based on historical data. The scale for SSHD data is measured in meters above and below the average (or mean) value for a given location.
Looking at an SSHD map, one sees immediately that sea level is not the same everywhere. Sea surface continually fluctuates due to natural forces, such as the trade winds, tides, waves, glacier melts, density, and gravity.
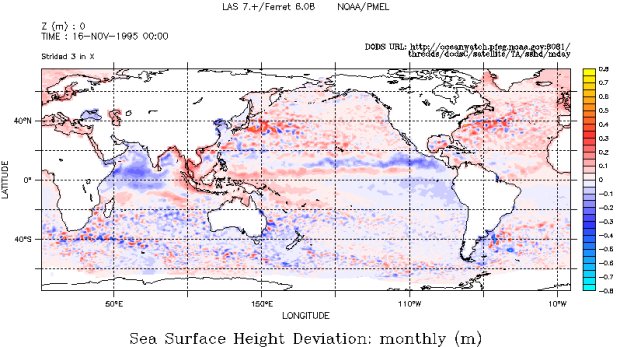
Below is an example of a map of sea surface height deviation. Use this map to check your understanding. Then try making your own map using real data.