 Level 1
Reading Sea Surface Temperature
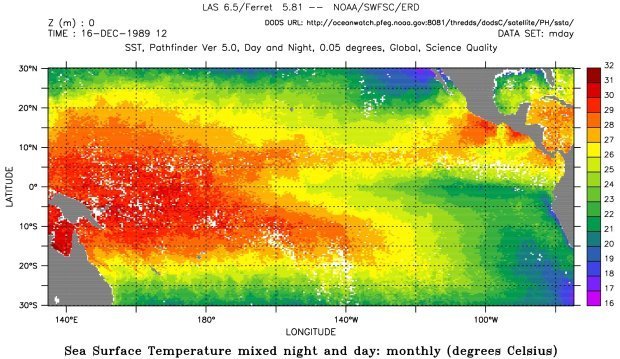
One of the ways to detect an El Niño event is to look at sea surface temperature (SST). SST can be recorded using instruments on orbiting satellites which measure infrared radiation from the surface of the oceans. This data can be represented on maps in different ways. Researchers map temperature zones using colors to represent areas of temperature, producing what is called a false-color map.
Below is an example of a false-color map of sea surface temperature. Use this map to check your understanding. Then try making your own map of sea surface temperature using real data.
